This tool is called from CEDAR's main menu or from the Database Query tool. It is used to display the content of a science data file and do some basic analysis and statistics.
The SDI_VIEWER can also be called directly from the IDL prompt and has a few optional command line parameters. For more details on using the tool in this manner, take a look at the source code header.
This program is based on FUSE_SCAN written by D. Lindler for FUSE quick look analysis.
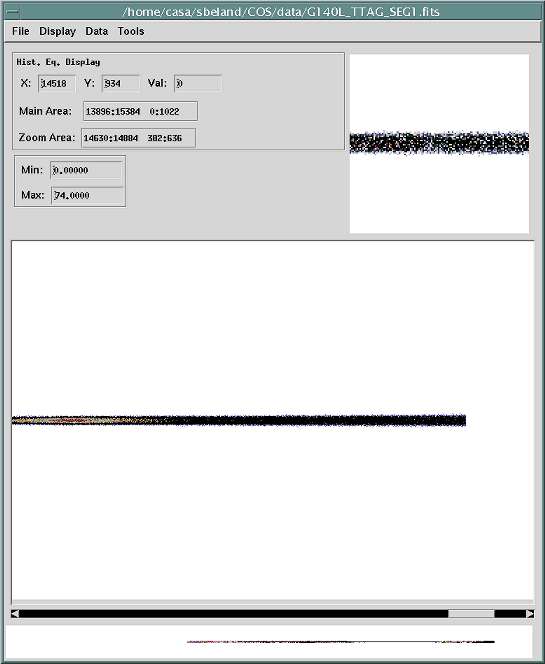
The SDI_VIEWER's main interface consists of:
The lower part of the tool shows the full extend of the data scaled to fit in the Full Image Window. This window is only visible for data taken with the COS FUV detector since the NUV detector has an aspect ratio which does not match this window and is best viewed in the Main Window.
The Main Window is the largest window of the SDI_VIEWER tool. The image is shown here with a zoom factor of one (one image pixel to one screen pixel) and scroll bars appear when the image is larger than the display window.
The Zoom Window is the smallest window of the SDI_VIEWER tool. The zoom factor can be adjusted from the top menu bar under Display->Zoom. This window will contain the portion of the image where the user clicked the mouse either in the Full Image Window or the Main Window.
The user accesses most of the SDI_VIEWER's functions through the menu bar. The menu consists of the following options:
| File | Display | Data | Tools |
The Status Line by default displays information about the type of contrast used to represent the data currently on the screen. The Status Line also presents instructions for the user on what to do next when using some of the tools and utilities of the SDI_VIEWER.
This area of the tool gives the coordinate position in pixels where the cursor is currently located in either of the three windows, Full Image, Main Window or Zoomed Area. The value of the pixel at that location is also provided.
This area of the tool gives the coordinate positions in pixels of the two opposite corners of the portion of the image displayed in the Main Window Area.
This area of the tool gives the coordinate positions in pixels of the two opposite corners of the portion of the image displayed in the Zoom Area.
These two editable boxes show the current minimum and maximum values of the display. By default these values are set to the minimum and maximum of the image data currently loaded. These values can be changed by the user to modify the range of data visible on the screen. Any data value less or equal to the minimum will show up as a pixel with the same color as the minimum value of the color table and any data value greater or equal to the maximum will have the color of the top value in the color table.